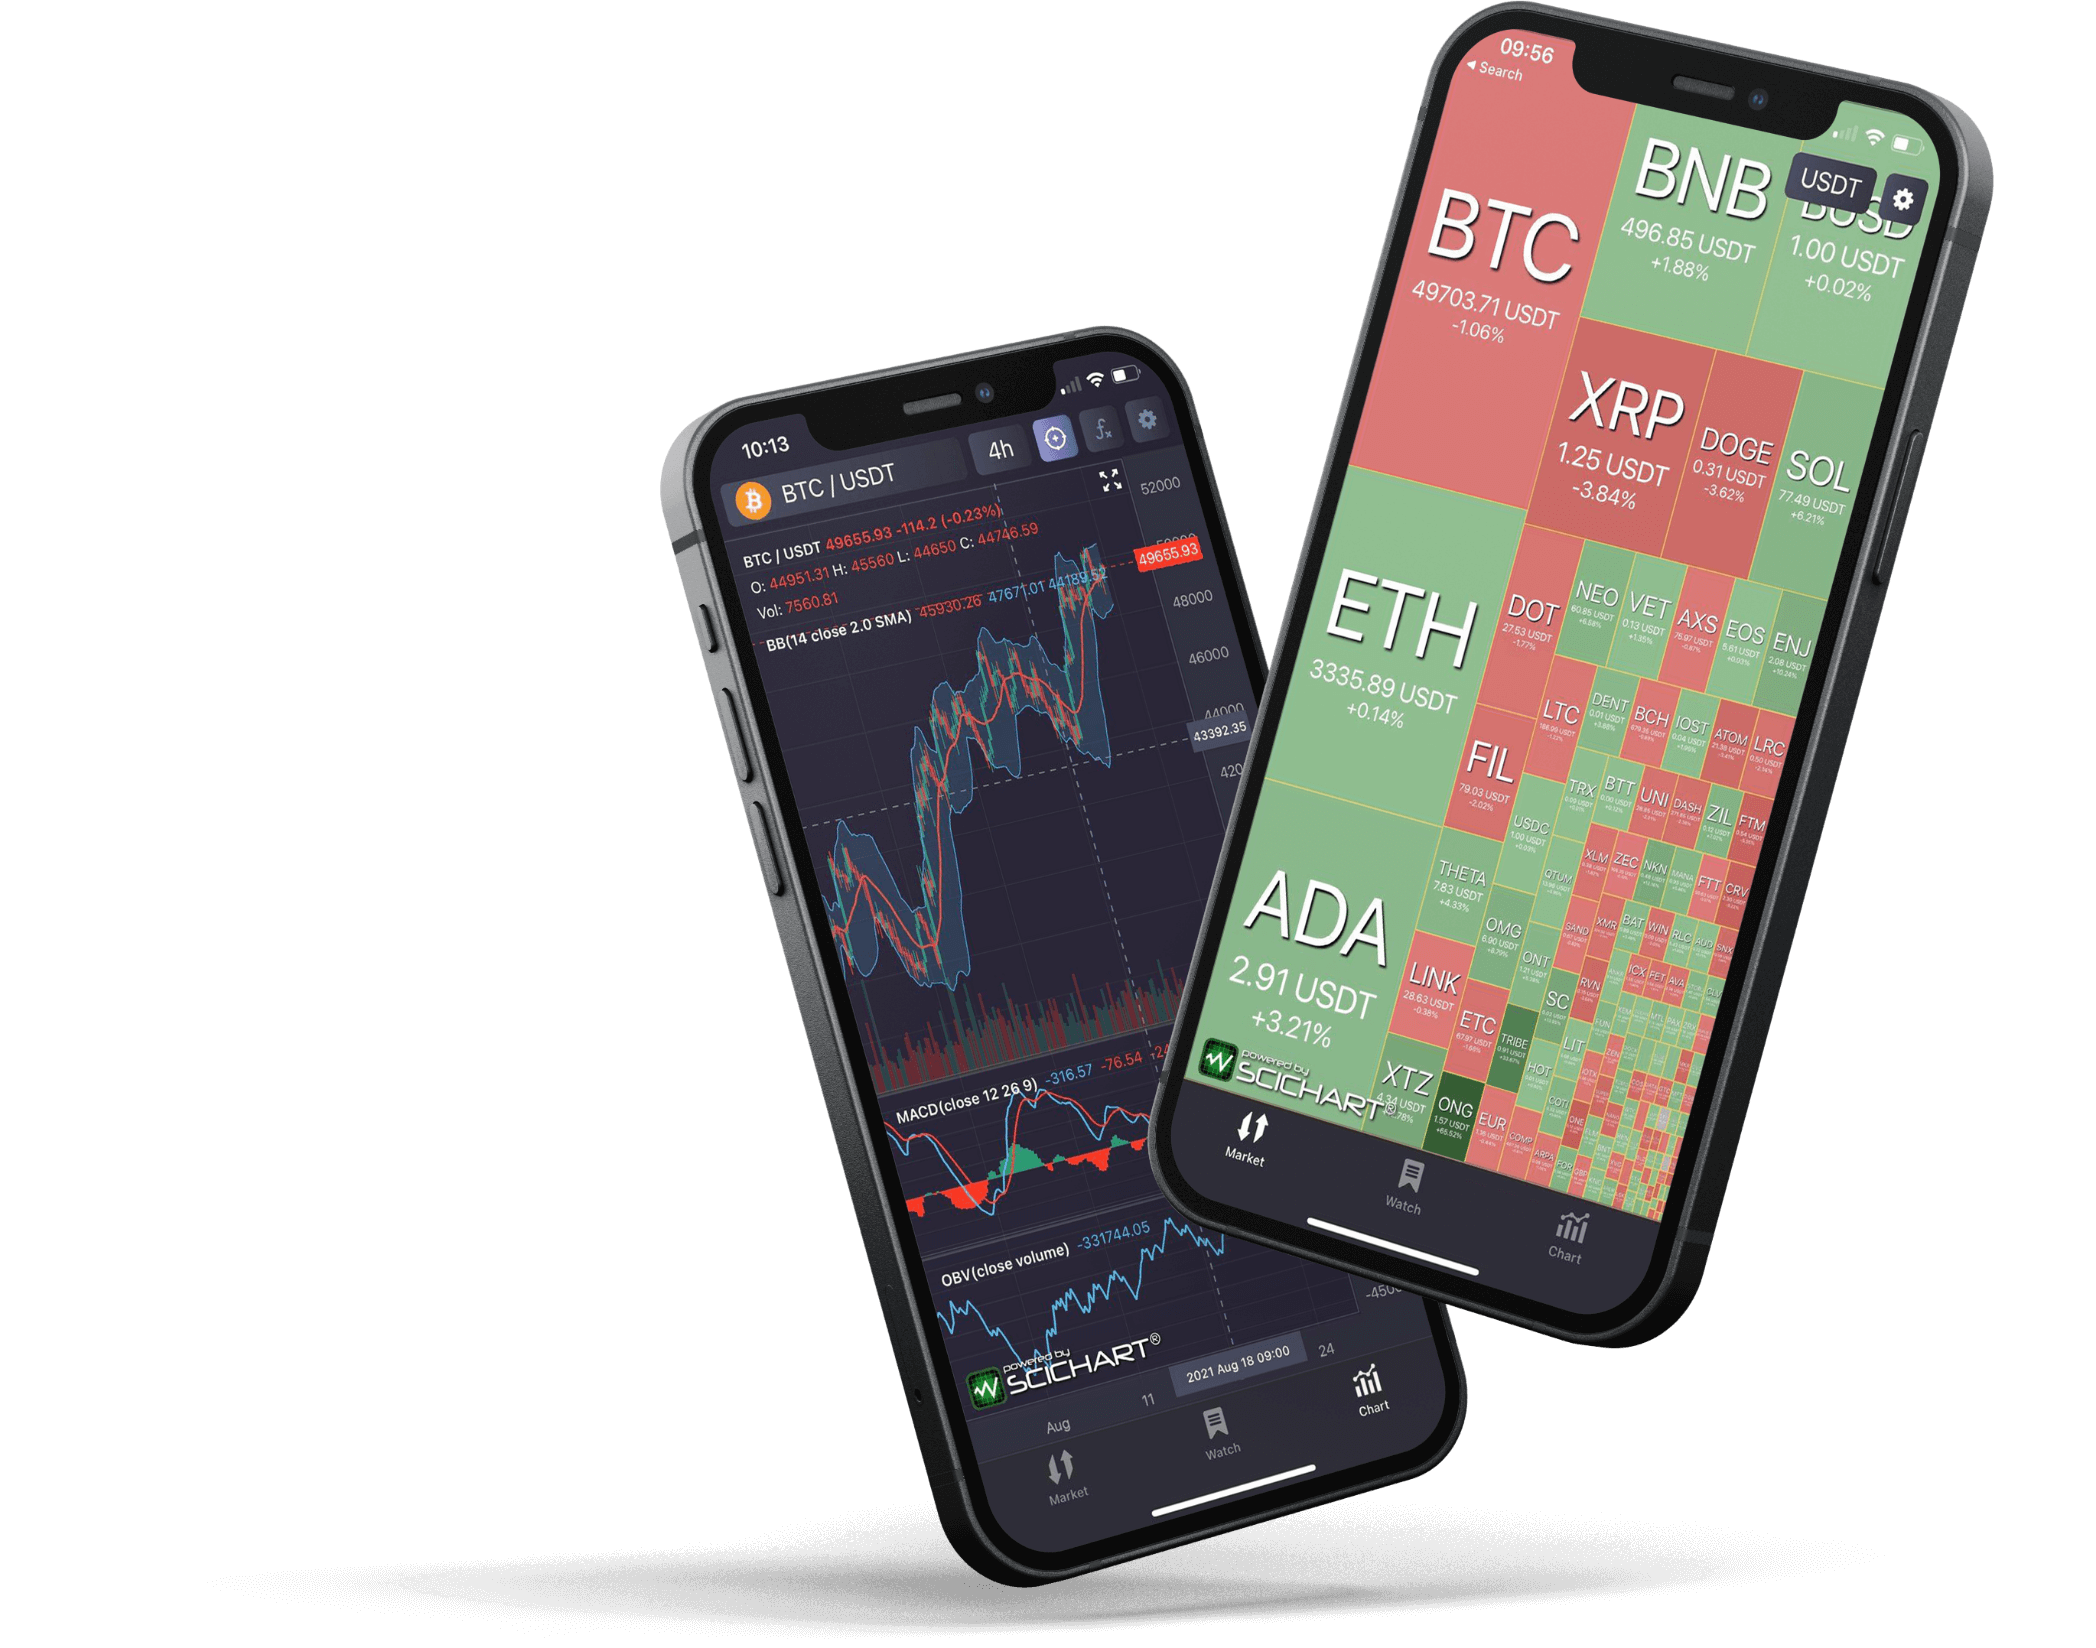
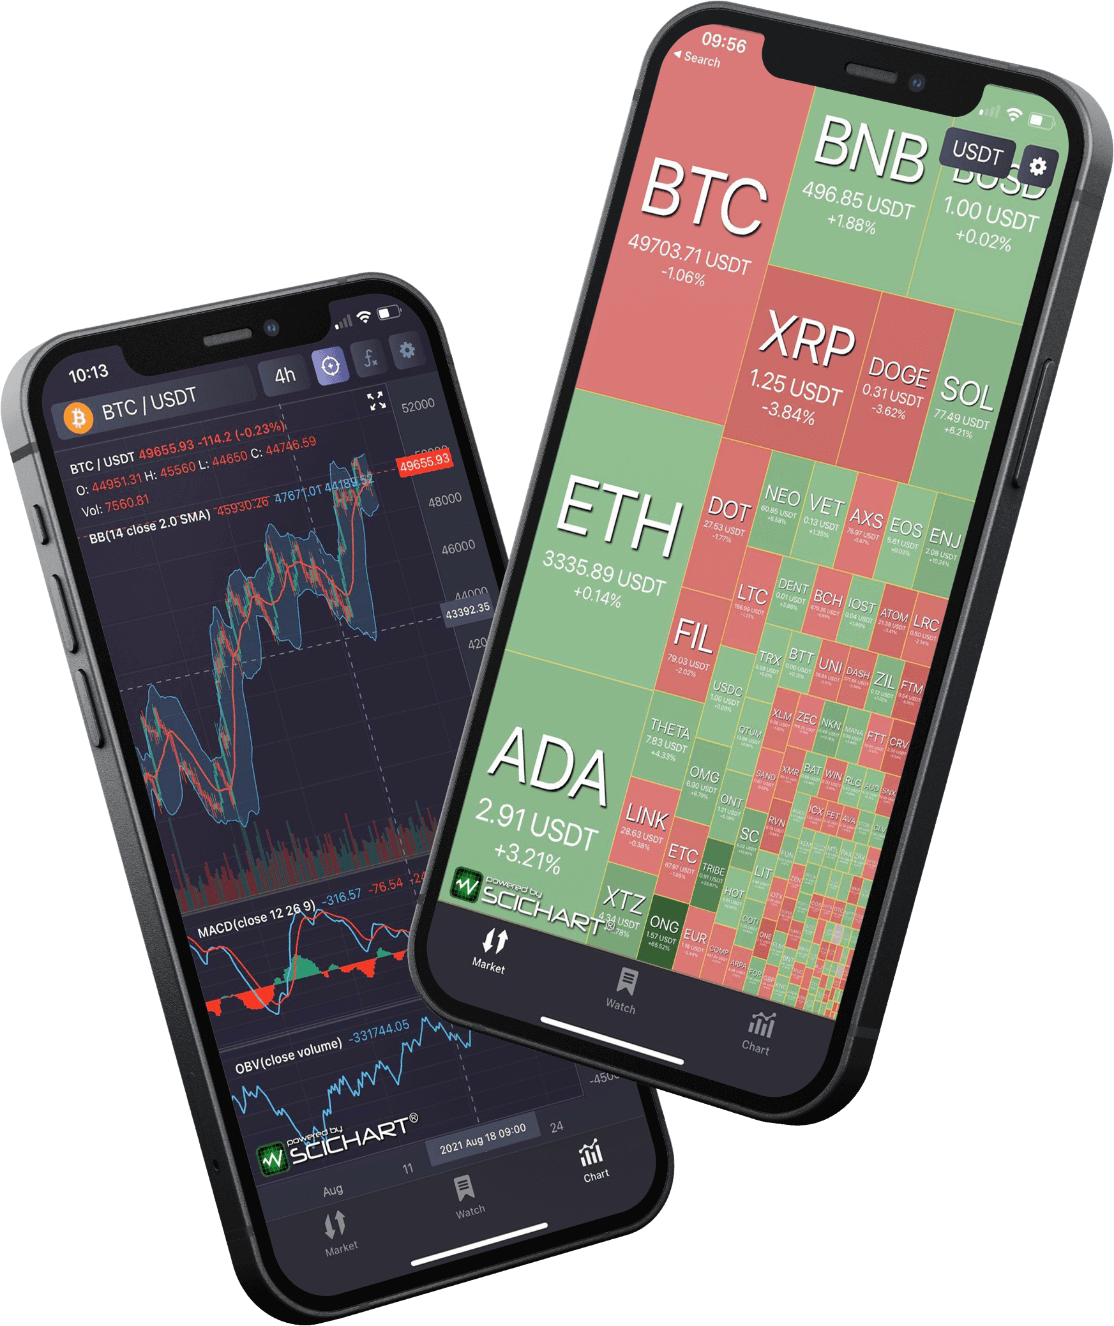
Powerful Mobile CryptoCurrency Charts
Market at a Glance
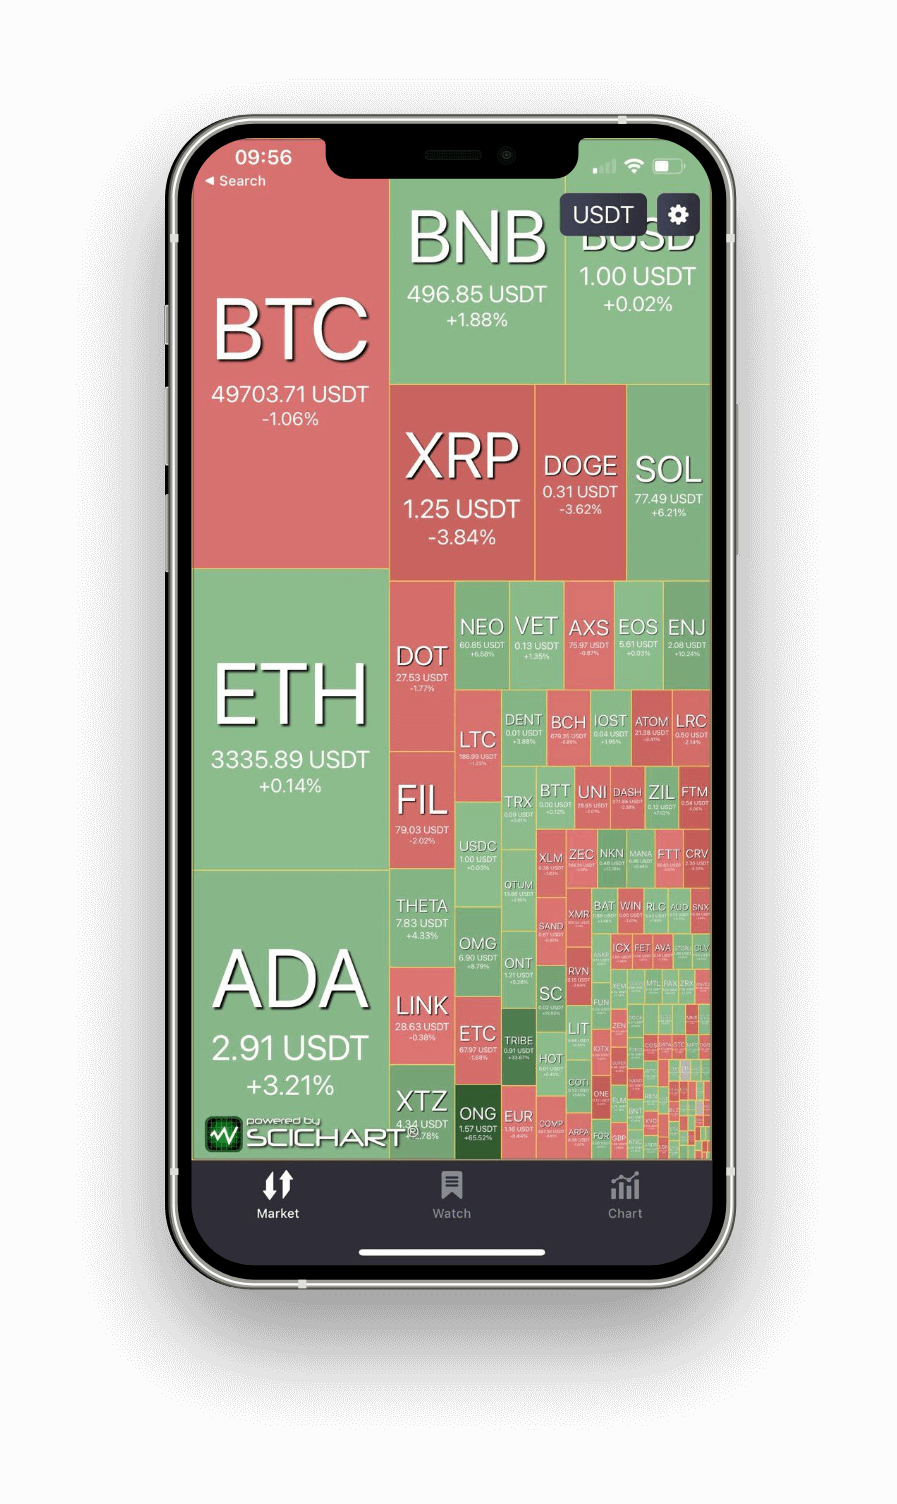
View the crypto markets at a glance. See what coins performed the best and worst.
Create Watchlists
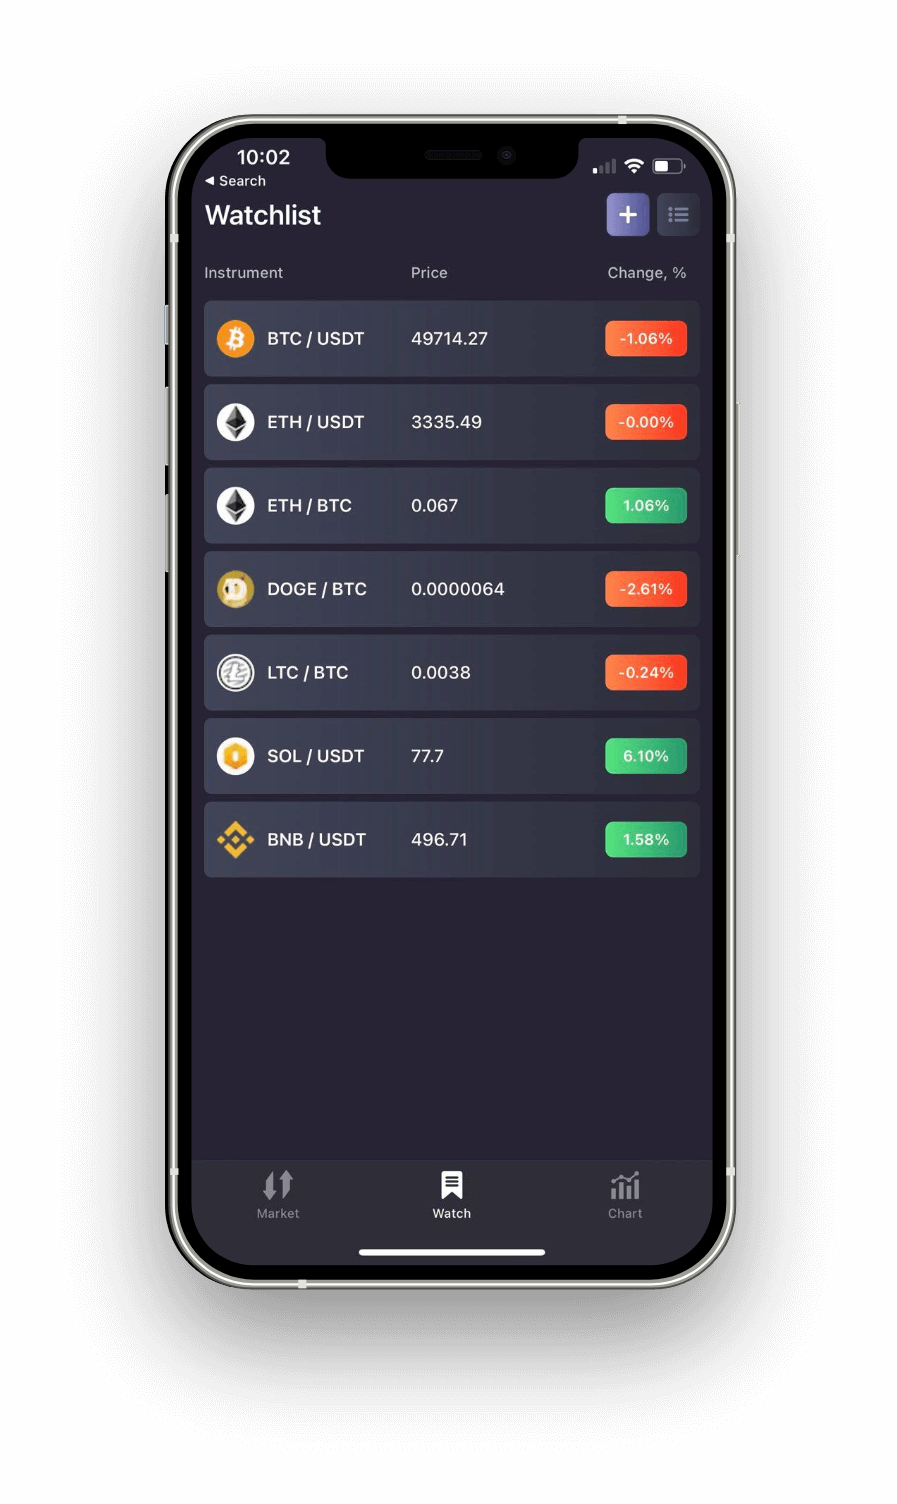
Add your favourite coins to watchlists. See the daily change and quickly navigate to chart.
Interactive LIVE Charts
High quality, smooth & slick trading charts with technical indicators and more.
See the Crypto Market at a glance
View a heatmap of the crypto market as a whole. What are the biggest gainers & losers? See which coins performed the best and worst over a 24-hour period and which coins have the biggest volume.
Change denominator from USDT to BTC or ETH to see market gainers/losers vs. US Dollar (Tether), Bitcoin or Ethereal.
Quickly spot trading opportunities by finding out what’s moving now.
Long press. Add to watchlist
Curate a watch list of your favourite cryptocurrencies. Long press a coin in the Market Overview Heatmap to add to watch or open chart. In the watch list you can also add / remove coins, see latest prices and 24-hour % change.
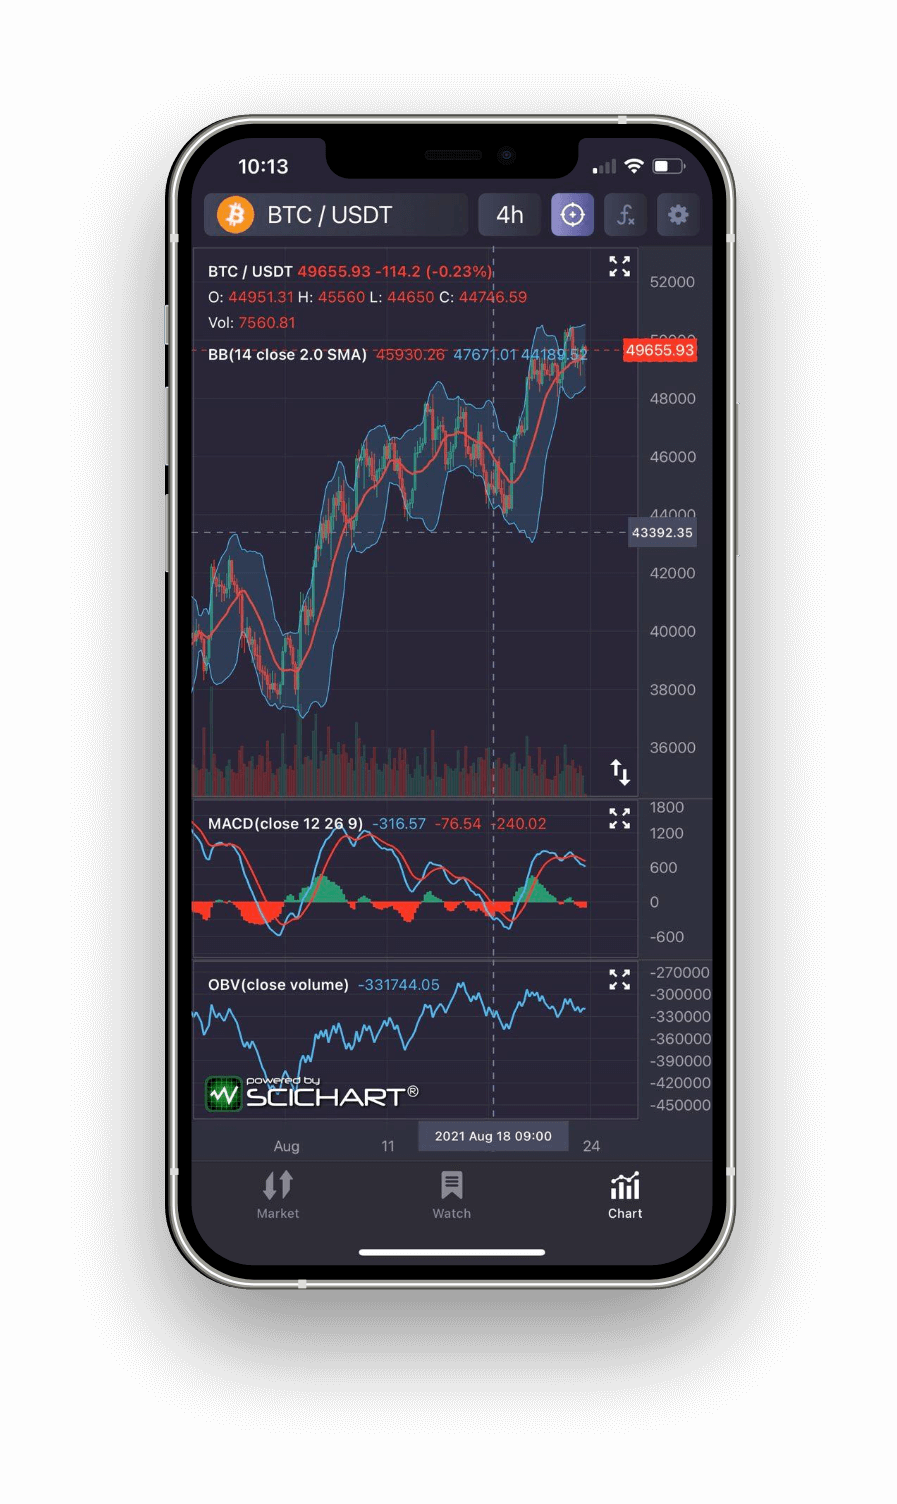
Fully interactive, realtime cryptocurrency price charts
View realtime cryptocurrency price charts with live updates on your mobile device.
SciTrader feature a fully interactive trading chart which you can zoom and pan by touch, drag the axis to scale or pan, pinch zoom the chart to scale time, double tap to zoom to fit. Scroll back in time to load more data into the chart. There’s no limit to the data you can display as SciTrader’s charts are super-fast, even on low-end mobile devices
Add technical
indicators & cursors to your charts
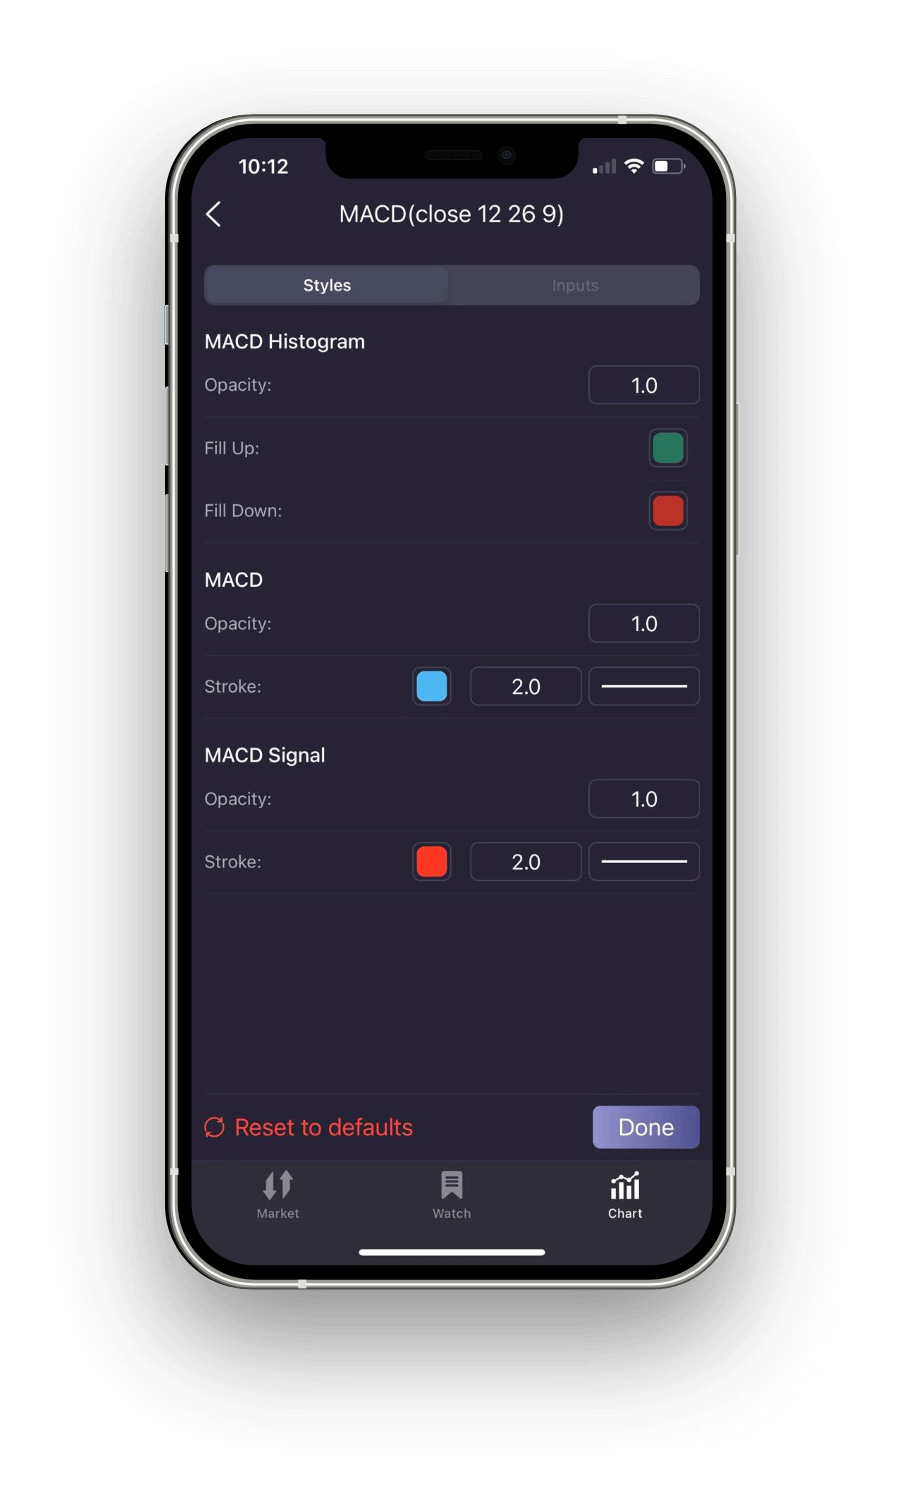
Setup a crypto trading chart the way you like it, with a variety of technical indicators to choose from, with fully customisable settings like colours, styles and input types.
Tap the cursor icon to add a crosshairs to your chart and see prices and indicator values in the legend.
Powered by SciChart. The World’s Fastest Charts
Powered by SciChart – award winning, high performance chart libraries for iOS, Android, Windows and JavaScript apps. SciTrader’s financial chart SDK builds upon SciChart to add professional grade financial charting libraries for native iOS & Android apps.
Our financial charting library is available for inclusion in your trading apps, exchange apps or investment apps, with pricing on application. Contact us today if you’d like to discuss using SciTrader’s & SciChart’s technology.
